
min read
As technology grows, develops and spreads, marketers and researchers have an ever greater ability to ‘see’ what consumers are doing, rather than relying on questions and answers. This includes web traffic and site and individual levels, exposure to digital advertising (and increasingly traditional advertising, with developments like Google Glass). Alongside this is the need to make better use of what people tell us about brands, products and services through social media (some almost ethnographically).
In the book Moneyball by Michael Lewis, the story of Billy Beane and the baseball team the Oakland A’s is told, explaining how in 2002 the A’s started to put a greater, verging on total, focus on statistics (called Sabermetrics) rather than traditional methods that Beane considered to be flawed, like speed and look. If you know American sport you’ll know that statistics and data have both been important for a long time. Beane’s view was that the wrong statistics were being looked at, and as a result data was being misinterpreted.
The challenge with using social media as a research solution is that the ‘data’ comes to us in completely unstructured sets. To make sense of it we need to overlay a meaningful structure, understand how representative it is, how complete a picture it paints, and ultimately draw insight from it.
Do we know enough about attitudinal differences between people who do and don’t use social media? Do we understand what impact being a frequent user of Facebook has upon brand KPIs? Having insight into this area allows us to begin unpicking what differences exist, helping us establish whether differences (if there are any) are due to demographics, attitudes or exposure and behaviour. This in turn allows for the contextualising of social media, letting us tread confidently into social media analysis and social media monitoring, measuring our online brand and social media footprint – and those of our competitors.
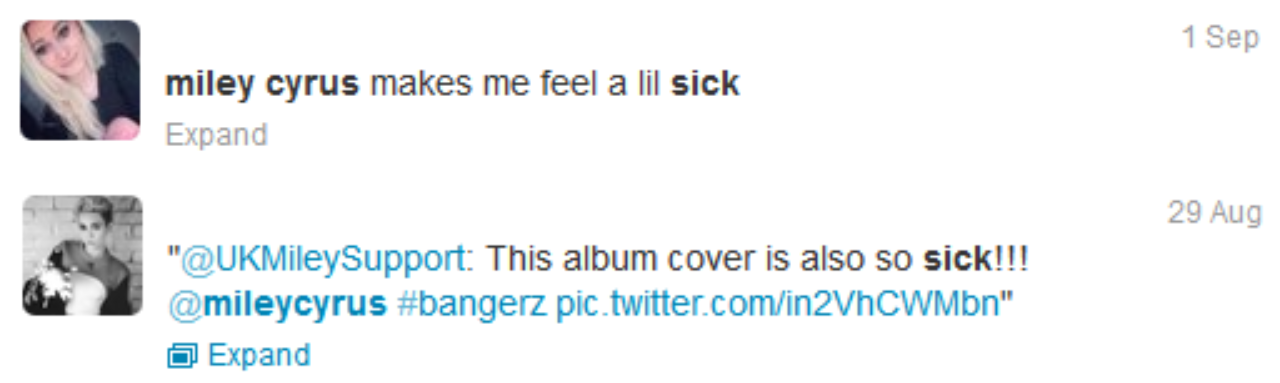
Crucially though, when setting up projects that draw on social media, we need to define our objectives clearly. Many social media analysis solutions use automated coding, which defines the sentiment and topic of a post. The benefit of this is that it’s cheap, quick and easily scalable. The issue with it can most easily be defined by the below tweets. In one, the reader gets the impression that the user is being negative about Miley Cirus. In the latter, the reader gets the impression that the user is positive towards Cirus’ album cover. However, most computer algorithms will see ‘sick’ to be negative, despite its common usage in a positive context. Irony tends to be misread and smileys and emoticons completely ignored.
The level of this inaccuracy is often vast, and with little consistency as to what’s over- or under-scored, as our test results below demonstrate.
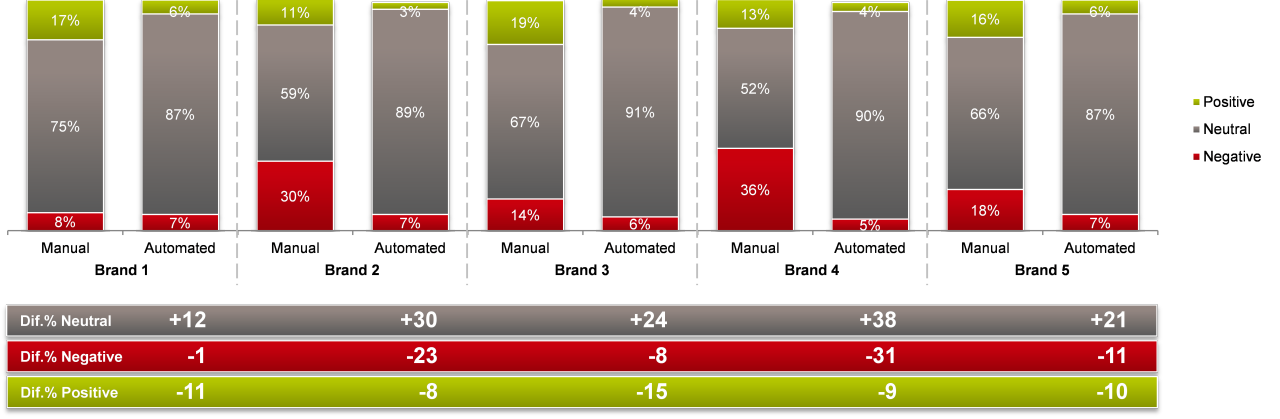
These inaccuracies can be lived with if sentiment and topic aren’t the focus of the analysis (for instance if you’re focused on the volume of buzz created by a new product launch you would want daily, if not hour-by-hour, buzz monitoring and keyword analysis would suffice). However, for insight-led and strategy-guiding analysis, accuracy is vital, and for this we need to adopt human coding, and to do this correctly you need to sample your data, as coding all mentions your brand draws is normally impractical given the size and scale (and therefore cost) of the task.
We recently ran some social media analysis in the UK that looked at mobile network operators (MNOs), using human coding. Set-up is often considered a hygienic factor within research, but it’s interesting to note that in order to look at the MNOs we focused on – Vodafone, O2, 3, Orange, T-Mobile, Everything Everywhere – we had to create over 150 search strings. Clearly, failing to adopt a thorough set-up process means you will either under-sample your mentions, creating an inaccurate picture of your brand, or over-sample, creating ‘noise’ and making it harder to draw insight and recommendations from your data.
What we found was very interesting:
- Sentiment varies by brand. Levels of negative sentiment range from 4% to 26%, though levels in positive sentiment only vary from 4% to 10%. How marketers approach social media needs to be determined by the way consumers approach their brand.
- People talk about different MNOs in different places. T-Mobile, Orange and EE attract attention from social networks to a greater extent than 3, Vodafone and O2, who were all more centred around forums. Brands need to have strategies that address different social media websites and apps, but address them in ways that suit the use of the consumer and social channel, not just the brand.
- Unbranded campaigns might show lost opportunities. When looking at 3’s Dance Pony Dance we saw that 67% of mentions were unbranded, making no reference to 3. This in itself might be fine, but with 9 in 10 posts being positive, this may represent unfulfilled potential with regards to positive expression brand.
To read the full case study click here >>
Of course, to go further than this we would look to link this analysis with quantitative research results, click through rates (CTRs), view times and other web metrics or use it to support qualitative work on future campaigns.
After Moneyball became popular Beane’s fame grew outside of baseball. At the same time, football was becoming increasingly popular in the USA, resulting in some English clubs being bought by American businessmen. One such team was Liverpool, who were bought by the owners of baseball’s Boston Red Sox. They tried to recruit Beane, and when he turned them down they recruited an associate of his, used the same approach and went on to win their first World Series in 86 years.
When the Red Sox owners took over Liverpool they brought with them experts in Sabermetrics, who legend has it identified the young Newcastle forward Andy Carroll as the player they needed, and spent £35 million on him to make him the (then) most expensive British player of all time. What they failed to do was adapt their data interpretation into a new field, and thus failed to read the data correctly. 18 months later Liverpool loaned the player to West Ham, before selling him at a £20 million loss.
The key benefits of social media as a research opportunity are its accessibility and pure consumer terminology. However, these are two of the main drawbacks as well, requiring us to overlay a meaning structure, which requires sampling and coding, and other research functions that cannot be administered by technology alone. Once done, and with sensible and accurate contextualisation and understanding, we can use social media analysis with confidence as part for an informed decision-making process. We can avoid signing Andy Carrolls and invest our money wisely, safe in the knowledge we’ve measured, modelled and understood the data correctly.
For more information on GfK Social Media Intelligence please contact Richard Bussy richard.bussy@gfk.com